Tracking your blood pressure is more than just recording numbers. It’s about understanding what those numbers reveal about your heart health over time. If you’ve ever wondered what your blood pressure trends really mean — especially when viewed over weeks or months — you’re not alone.
In this beginner’s guide, we’ll walk through how to interpret your blood pressure data, why trends matter more than one-off readings, and how the Progress View in BPTrakr can help you make sense of it all.
Why Blood Pressure Trends Matter
When you visit your doctor, you usually get one reading. But that single number can be affected by stress, caffeine, or even how fast you walked into the office. That’s why long-term trends are more useful for evaluating your cardiovascular health.
Tracking your readings regularly can help detect:
-
Hypertension (consistently high readings)
-
Hypotension (unusually low readings)
-
White coat syndrome (high at the doctor’s, normal at home)
-
Masked hypertension (normal at the doctor’s, high at home)
A consistent pattern reveals whether you’re improving, stable, or need to adjust your lifestyle or medication.
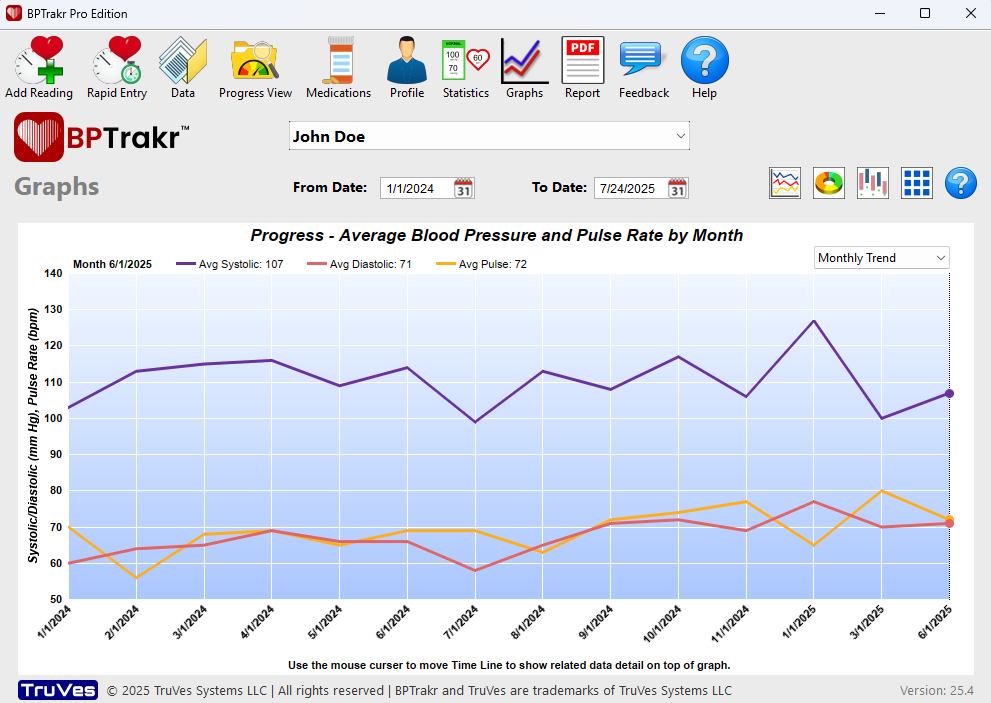
Understanding BPTrakr’s Progress View
The Progress View feature in BPTrakr is designed to help you visualize your blood pressure trends over time. Whether you log your results daily or weekly, this feature turns raw data into easy-to-read charts that reveal:
-
Systolic and diastolic averages over selected time periods
-
Morning vs. evening reading comparisons
-
Color-coded zones based on American Heart Association (AHA) guidelines
You can also filter by date range, print a report, or export data for your doctor.
Learn how to use Progress View in BPTrakr.
Interpreting Your Trends: What to Look For
Here’s a quick guide to help interpret your results:
| Trend | What It May Mean |
|---|---|
| Gradual decrease in readings | Lifestyle changes or medication are working |
| Sudden spikes | Stress, illness, or medication side effects |
| Higher morning readings | Possible early hypertension warning |
| Wide variation (fluctuating) | Could suggest stress or other underlying conditions |
| Consistently elevated levels | Likely chronic hypertension; discuss with doctor |
Tip: Aim for consistency — take your readings at the same time of day, seated and relaxed, for the most accurate trends.
️ How to Get the Most Out of BPTrakr
-
Log regularly: The more data you input, the more accurate your trend analysis will be.
-
Use labels (notes): Mark your readings (e.g., “After workout”, “Before medication”) to spot correlations.
-
Generate printable reports: Great for bringing to doctor visits. Learn how to print a report.
Additional Resources
Final Thoughts
Knowing your numbers is just the start — understanding your trends is what empowers you to take charge of your health. BPTrakr’s Progress View was built with this in mind: to give you a clear, reliable way to monitor and improve your cardiovascular wellness.
Start exploring your own trends today by logging in to your BPTrakr dashboard — and if you haven’t yet, download BPTrakr for Windows or Mac.
Disclaimer
Note: Only a qualified medical professional can confirm a blood pressure–related diagnosis. The information in this article is for educational purposes only and should not replace professional medical advice.