

Printable blood pressure charts and reports can help you monitor trends over time and share organized readings with your doctor during appointments. This guide explains how to create professional blood pressure charts, logs, and printable PDF reports using BPTrakr.
📊 Why Your Doctor Wants a Printed Blood Pressure Log
Many doctors find that blood pressure readings taken at home can be more reliable than those taken in a clinical setting, since patients are typically more relaxed in their own environment. This helps reduce the effects of temporary stress or anxiety, sometimes referred to as “white coat” readings, and provides a more accurate picture of your day-to-day blood pressure levels.
A printed log helps your doctor:
- Identify trends over days or weeks
- Adjust medications more accurately
- Spot patterns related to lifestyle or diet
- Make better treatment decisions
A structured log—rather than scattered notes—makes this process much easier.
✍️ Option 1: Use a Printable Blood Pressure Log (Manual Method)
You can download and print a basic blood pressure log sheet and fill it in manually.
Typical logs include:
- Date and time
- Systolic (top number)
- Diastolic (bottom number)
- Notes (medication, symptoms, etc.)
Printable charts are widely available and provide a simple way to track readings over time.
Pros:
- Simple and free
- No software required
Cons:
- Easy to make mistakes
- Hard to spot trends
- Can look messy or incomplete
📈 Option 2: Use Excel or Spreadsheets
Some people use Excel or Google Sheets to track blood pressure.
This allows you to:
- Store data digitally
- Create basic charts
- Print a log
Pros:
- More organized than paper
- Some charting capability
Cons:
- Time-consuming
- Requires setup
- Not designed specifically for medical reporting
🚀 The Easiest Way: Generate a Professional Report
Instead of manually creating logs, you can use dedicated software to:
- Track readings automatically
- Generate clean charts
- Export a doctor-ready PDF report
For example, tools like BPTrakr allow you to:
- Enter readings in seconds
- Automatically calculate trends and averages
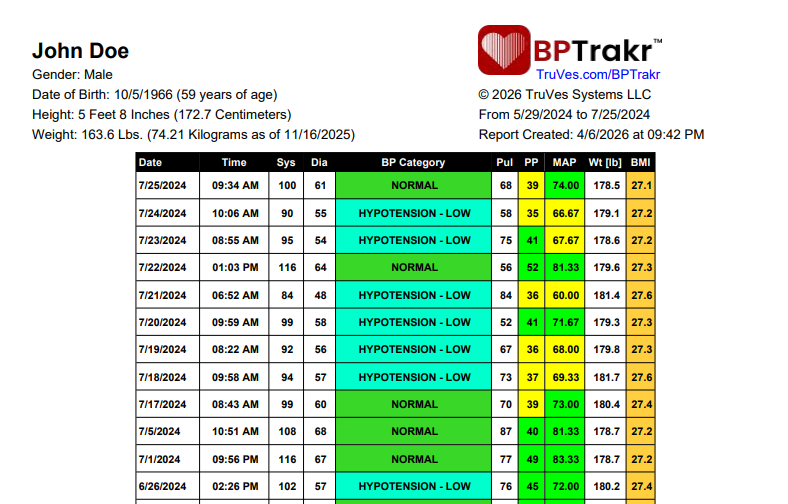
- Create a clean, printable report with graphs and statistics
This is especially useful if you regularly share your data with your doctor.
✔ Create a Clean Blood Pressure Report in Seconds
Rather than formatting spreadsheets or handwriting logs, you can generate a professional report instantly:
- Clear, easy-to-read layout
- Organized data tables
- Visual charts showing trends
- Print-ready PDF format
👉 This makes it much easier for your doctor to review your progress.
📥 Download BPTrakr (Free)
✔ Create clean, doctor-ready reports
✔ No cloud — your data stays private
✔ No ads or distractions
👉 Download BPTrakr Free and generate your first report in minutes
🧾 What to Include in Your Blood Pressure Log
No matter which method you use, your log should include:
- Date and time of reading
- Systolic and diastolic values
- Heart rate (optional)
- Notes (medication, stress, symptoms)
Consistency is key—record readings at the same times each day for best results.
🧠 Tips for Accurate Readings
To ensure your log is useful:
- Measure at the same time each day
- Sit quietly for a few minutes before measuring
- Avoid caffeine or exercise beforehand
- Take multiple readings and average them
Accurate data leads to better medical decisions.
🏁 Final Thoughts
Printing a blood pressure log for your doctor doesn’t have to be complicated.
You can:
- Use a simple printable sheet
- Track data in a spreadsheet
- Or generate a professional report automatically
👉 If you want the easiest and most reliable option, using dedicated software can save time and produce much clearer results.
📌 Quick Summary
- Doctors prefer structured, printed logs
- Manual methods work—but are limited
- Software provides the best clarity and convenience
👉 Start tracking today and bring a clear, professional report to your next appointment
Ready to Try BPTrakr?
You can download the latest version of BPTrakr for Windows, macOS, and Linux here:
Download BPTrakr