Page Last Updated on 2025-03-12
New for Version 25.1

The incremental frequency for the Blood Pressure and Pulse Progress Table and Graph in BPTrakr Reports is set to Weekly by default. However, you can change the frequency to Monthly or Yearly by changing the Report Configuration Settings in BPTrakr Reports.
Note: The Blood Pressure and Pulse Progress Table and Graph can be included in Reports only when you upgrade to the Pro Edition of BPTrakr.
How to Set the Incremental Frequency for the Blood Pressure and Pulse Progress Table and Graph in BPTrakr Reports
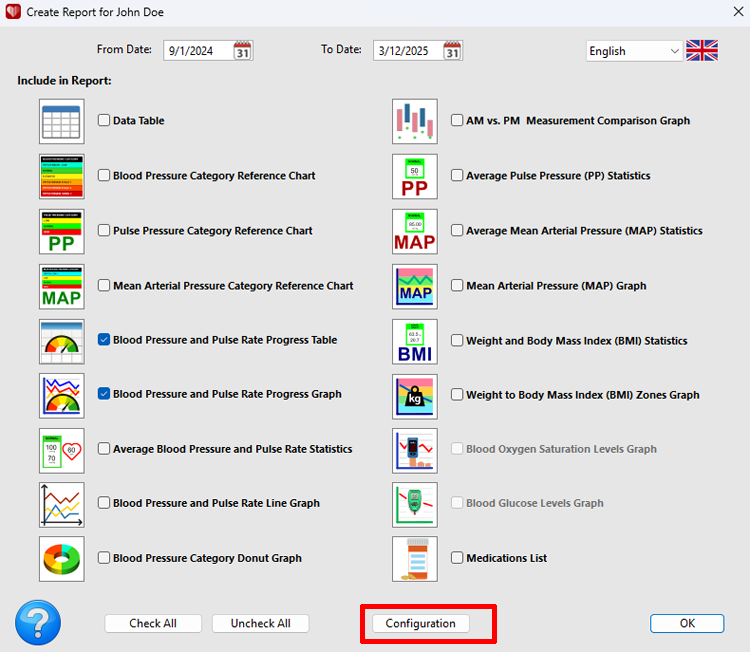
Step 1: On the toolbar, click on the Report button and select Create Report from the dropdown list. The Create Report window will appear.

Step 2: On the Create Report window, select the desired date range. Then select the language of the report. Also select or deselect the desired elements to be included in the report. For this example, we are selecting the Blood Pressure and Pulse Progress Table and Graph. Click on the Configuration button near the bottom of the window. The Report Configuration window will appear.
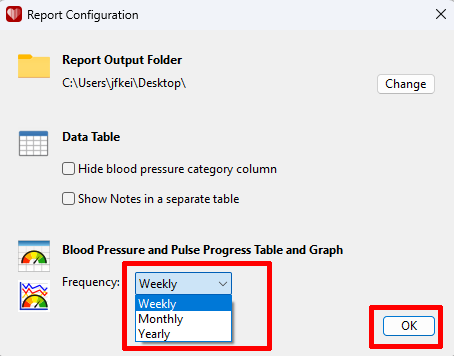
Step 3: On the Report Configuration window, under Blood Pressure and Pulse Progress Table and Graph, on the drop-down menu, select the incremental frequency for the data to be displayed in the report. The following frequencies are available:
- Weekly
- Monthly
- Yearly
Then click the OK button.
Step 4: On the Create Report window, click the OK button to create the report.
Comments / Questions