Page Last Updated on 2025-08-17
New for Version 25.1
A note about the graphs in the BPTrakr Free Edition
Please note that the BPTrakr Free Edition displays the graphs with a digital watermark with the words “BPTrakr – Upgrade To Pro Edition”. Graphs shown in the BPTrakr Pro Edition do not contain this watermark. To learn more about the BPTrakr Pro Edition and it’s pricing go to the BPTrakr product page.
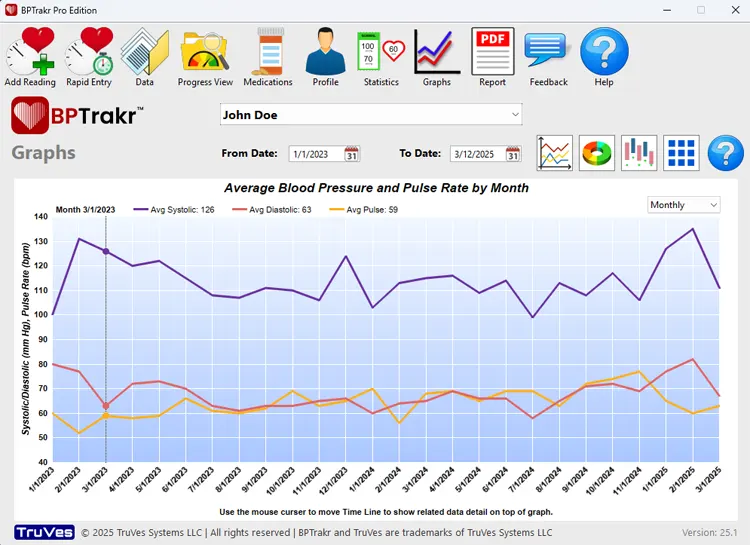
What is the Progress View Graph?
The Progress View Graph displays the average values of your blood pressure readings on weekly, monthly, or yearly increments. This data format shows the incremental progress of your blood pressure measurements over the selected date range.
How to access the Progress View Graph
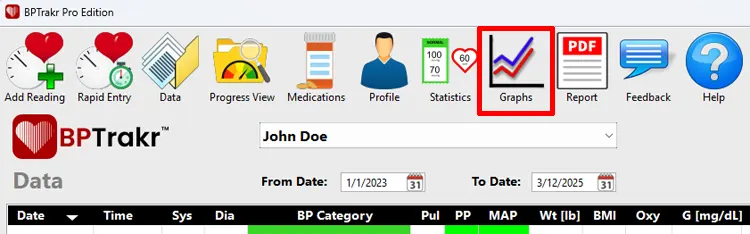
Step 1: On the toolbar, click on the Graphs button. The Graphs screen will appear.
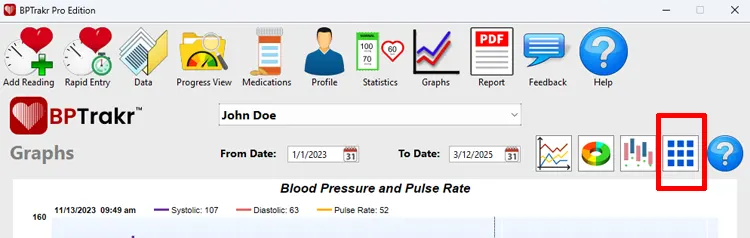
Step 2: On the Graphs screen, click on the More Graphs button. The More Graphs window will appear.
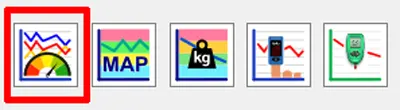
Step 3: On the More Graphs window, click on the Blood Pressure and Pulse Progress Graph button. The Blood Pressure and Pulse Progress Graph will appear.
Step 4: Select the date range of the data that you would like to view using the From Date and To Date fields.
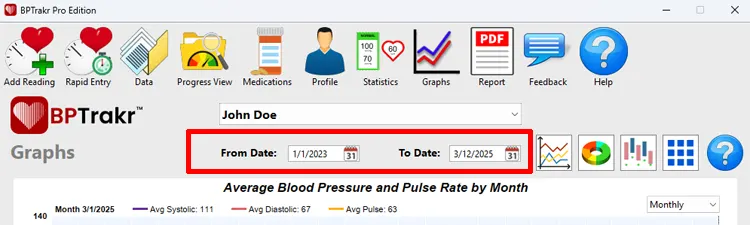
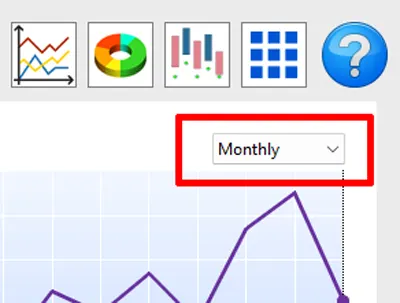
Step 5: From the drop-down menu near the top of the graph, select the incremental frequency for the data to be displayed in the graph. The following frequencies are available:
- Weekly
- Monthly
- Yearly
The Blood Pressure and Pulse Progress Graph will show data based on the selected date range and the selected incremental frequency.
See also
- Tracking Your Blood Pressure Progress Using Progress View
- Viewing the Blood Pressure and Pulse Rate Line Graph
- Viewing the Blood Pressure Category Donut Graph
- Viewing the AM vs PM Measurement Comparison Graph
- Viewing the Blood Oxygen Saturation Levels Graph
- Viewing the Blood Glucose Levels Graph